Vocabulary
1. Demographics – The study of human populations
2. How much did the human population grow in the 20th century?
The human population tripled during the 20th century.
3. Exponential Growth –When population and growth rate both increase
4. Linear Growth-Only population rate increases, growth rate is steady.
5. Doubling Time –Estimation of how long for a population to double in size
6. Developing Countries –are poor, young, and rapidly growing.
7. Developed Countries –are wealthy, old, and mostly shrinking.
8. Fertility Rate-Number of births per 1000 women per year.
9. Total Fertility Rate –Average number of children a woman has in her lifetime.
10.Replacement Level – is when you have 2.1 children per couple
11. Emigration – Move out of an area
12. Immigration – Move into an area
13. Life Expectancy – Average age a newborn can expect to attain in any given society
14. Pronatalist Forces - Factors that increase the desire for children
15. Antinatalist Forces- Factors that decrease the desire for children
Critical Thinking
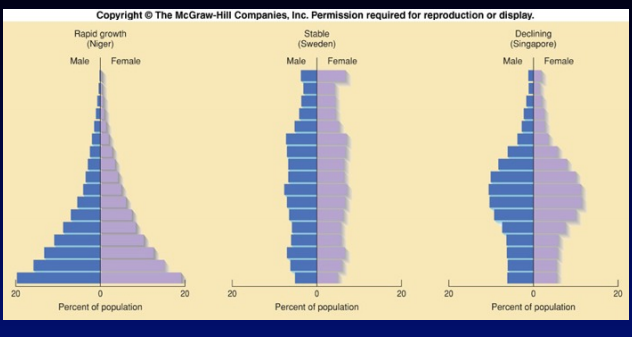
6. What is an age structure diagram (population pyramid)? Draw a pyramid representing each of the 3 “stages” (Rapid growth, Stable, Declining).An age structure diagram shows distribution of ages in a population at a specific time.