Title: What is the effect of excess nutrients onto phytoplankton growth?
Backround
Humans use alot of stuff the emit alot of CO2. Also know as Carbon Dioxide, we have alot of co2 inside of the atmosphere and it is beginning to be bad and is causing alot of problems. Scientist have found a way to take out some of the co2 out of the atmosphere. That is by phytoplanktons. Phytoplanktons feed on two key things that is Nitrates and Phosphates. They also produce more in areas with more iron.The iron within phytoplankton acts as a "catalyst" and an "electron carrier" during it's photosynthesis. Phytoplankton are important in the food web because they feed fish and the bigger fish feed on that fish. If phytoplankton die off then small fish would die because there wouldnt be any more food for them.
Hypothesis
If Phytoplankton are put into flasks of various nutrients, then the phytoplankton with iron will grow better.
The Protocol
Materials:
- 5 mL of phytoplankton
culture
- 50 mL of filtered
seawater
- 50-250mL Erlenmeyer
flask
- Cotton ball
- Available light source (sunny window is fine) - 3-300 µl pipettes
- Nitrate, Phosphate and Iron nutrient solutions
- Wax pencils
- Microscopes and microscope slides
- Spectrophotometer (if possible)
Procedures:
1. Each lab pair should have one flask. Each group should have three flasks between the three
groups. (The replication of the treatments is across the entire class- class data will be shared)
2. Student pairs must label their flask with the appropriate label with the wax pencil:
- Control
- + Nutrients (Nitrate and Phosphate)
- + Nutrients and Iron (Nitrate, Phosphate and Iron)
3. Add an equal amount of pure filtered seawater (50ml) to each flask.
4. Cover the top of the container labeled “Control” with a cotton ball.
5. Add an equal amount of nitrate and phosphate to each “+Nutrients” container using the table
below as a guide. Add iron to only one of the flasks and label it as “Nutrients + Iron.” Calculate
how much you would have to add to each flask to get the final concentrations listed in the table.
Hint: Use the following equation ( Molarity final * Volume final = Molarity Initial (Stock
Solution)* Volume Initial (Amount added of the stock solution) ). You are solving for the “Volume
initial” which is the amount of the nutrient stock solution you should add to each flask. Beware
of units!
6. After you have added 300µl of each nutrient to your treatments, cover the tops of the flasks
labeled “+Nutrients” and “Nutrients + Iron” with a cotton ball.
7. Add an equal amount of the stock algal culture (5 mL) to each flask.
8. Place all flasks in a sunny window or under grow lights where they can receive equal amounts
of light and make sure they can be exposed to the same temperatures (don’t place some on a
heater and others near the open window).9. Over the course of 5 days, you will make observations regarding the algae using microscopes
and the spectrophotometer.
Measuring the Phytoplankton:
1. To measure the phytoplankton using the microscopes, you should swirl the phytoplankton
solution for 1 minute to mix it well and then take 3 drops of solution and place onto a
microscope slide with a counting grid. Focus the microscope and count the amount of cells you
see on the slide (without moving the slide) using a light microscope.
2. You will also monitor the phytoplankton concentrations using the spectrophotometer in the
classroom. See the additional sheet on using the spectrophotometer. Microscope measurements
and spectrophotometer measurements will be compared in the lab write-up.
Graphs:
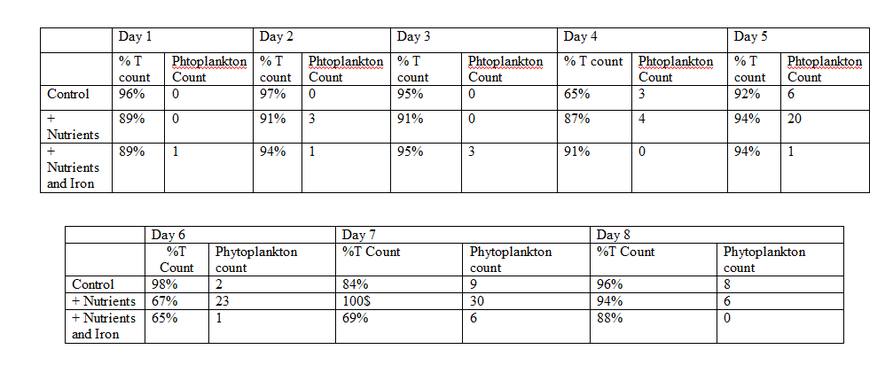
1. Using the data you have collected in your lab notebook (share the data from each treatment
with your group) you should make a graph of the growth of each treatment. Place the day on the
x-axis and the growth on the y-axis (% transmission) and plot all three treatments on the graph
(Control, + Nutrients, + Nutrients and Iron).
- 5 mL of phytoplankton
culture
- 50 mL of filtered
seawater
- 50-250mL Erlenmeyer
flask
- Cotton ball
- Available light source (sunny window is fine) - 3-300 µl pipettes
- Nitrate, Phosphate and Iron nutrient solutions
- Wax pencils
- Microscopes and microscope slides
- Spectrophotometer (if possible)
Procedures:
1. Each lab pair should have one flask. Each group should have three flasks between the three
groups. (The replication of the treatments is across the entire class- class data will be shared)
2. Student pairs must label their flask with the appropriate label with the wax pencil:
- Control
- + Nutrients (Nitrate and Phosphate)
- + Nutrients and Iron (Nitrate, Phosphate and Iron)
3. Add an equal amount of pure filtered seawater (50ml) to each flask.
4. Cover the top of the container labeled “Control” with a cotton ball.
5. Add an equal amount of nitrate and phosphate to each “+Nutrients” container using the table
below as a guide. Add iron to only one of the flasks and label it as “Nutrients + Iron.” Calculate
how much you would have to add to each flask to get the final concentrations listed in the table.
Hint: Use the following equation ( Molarity final * Volume final = Molarity Initial (Stock
Solution)* Volume Initial (Amount added of the stock solution) ). You are solving for the “Volume
initial” which is the amount of the nutrient stock solution you should add to each flask. Beware
of units!
6. After you have added 300µl of each nutrient to your treatments, cover the tops of the flasks
labeled “+Nutrients” and “Nutrients + Iron” with a cotton ball.
7. Add an equal amount of the stock algal culture (5 mL) to each flask.
8. Place all flasks in a sunny window or under grow lights where they can receive equal amounts
of light and make sure they can be exposed to the same temperatures (don’t place some on a
heater and others near the open window).9. Over the course of 5 days, you will make observations regarding the algae using microscopes
and the spectrophotometer.
Measuring the Phytoplankton:
1. To measure the phytoplankton using the microscopes, you should swirl the phytoplankton
solution for 1 minute to mix it well and then take 3 drops of solution and place onto a
microscope slide with a counting grid. Focus the microscope and count the amount of cells you
see on the slide (without moving the slide) using a light microscope.
2. You will also monitor the phytoplankton concentrations using the spectrophotometer in the
classroom. See the additional sheet on using the spectrophotometer. Microscope measurements
and spectrophotometer measurements will be compared in the lab write-up.
Graphs:
1. Using the data you have collected in your lab notebook (share the data from each treatment
with your group) you should make a graph of the growth of each treatment. Place the day on the
x-axis and the growth on the y-axis (% transmission) and plot all three treatments on the graph
(Control, + Nutrients, + Nutrients and Iron).
The Data
The Graph
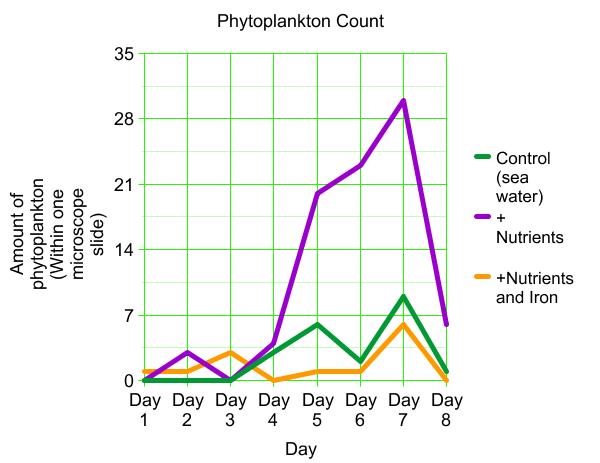
The Conclusion
When i started this lab my original hypothesis was " If Phytoplankton are put into flasks of various nutrients, then the phytoplankton with iron will grow better". That hypothesis was not correct. If you look at the data the one with nutrients and iron they didnt grow as much as the ones with only nutrients. I think that our experiment got messed up because other tables had different data. Like if if five groups all perform the same experiment but one group gets data different then the other groups, then we can assume that either the other four groups had error or the one group had error. From experiments like such.
